In UK later living operator boardrooms, the conversation usually gets around two things: “How many enquiries did we get?” and “How many move-ins did we achieve?” While these numbers are important, they are lagging indicators. They tell you what happened last month, but they don’t tell you what is going to happen next quarter. If you really want to understand the health of your community, you need to look at Sales Velocity.
At Jacobs Brain, we’ve distilled twenty years of sector expertise into a single, proprietary metric: the Sales Velocity Index (SVI).
If occupancy is the destination, the SVI is your speedometer. Here’s why this simple 0–100 score system should be the standard for Sales and Marketing Directors across the UK.
What is the Sales Velocity Index?
The SVI isn’t a “vanity metric.” It is a weighted, composite score designed specifically for the unique nuances of the retirement and later living sector. Unlike a standard CRM report, the SVI measures the momentum of your pipeline.
It answers the critical question: How quickly and efficiently is your community converting interest into occupancy?

We calculate the SVI based on four distinct dimensions, each weighted to reflect its impact on the bottom line:
1. Pipeline Volume
You can’t have velocity without fuel. This measures the sheer number of active opportunities currently moving through your funnel. We start the clock running from the First Visit. However, volume alone isn’t enough; the SVI looks at whether you have enough leads to meet your occupancy targets based on industry conversion norms.
2. Conversion Rate
This is the “efficiency” gear. How many of those enquiries actually become visits? How many visits become reservations? A high-volume pipeline with a low conversion rate suggests you are wasting marketing spend on the wrong audience. The SVI rewards efficiency over raw numbers.
3. Deal Quality
Volume tells you how busy you are. Quality tells you how effective you are. Not all leads are equal. “Deal Quality” indicates prospect readiness, and their fit will show as drop-offs between stages; Lead to First Visit, . It tells you not just how many people you’re attracting, but how good those people are at moving forward and to becoming a buyer. The SVI filters out the noise to show you the real revenue potential.
4. Cycle Time
Time is the enemy of the deal. In the UK, the average time from enquiry to completion will likely stretch over many months. The SVI tracks the “days in stage.” If your leads are sitting in the “Reservation” stage for too long without moving to “Completion,” your velocity score will drop, acting as an early warning system for your operations team.
Why “Standard” KPIs Are Failing You
Most operators rely on spreadsheets that show “snapshots” in time. You might see that you have 50 enquiries this month, the same as last month. On paper, things look stable.
However, if your Cycle Time has increased from 60 days to 90 days, your business is actually slowing down. You are burning more overhead to achieve the same result. The Sales Velocity Index catches these subtle shifts that standard KPIs miss. It tells you if your community is accelerating or stalling before the vacancy rates start to climb.
Benchmarking: Knowing Your “True North”
A Sales Velocity score of 65 might sound “okay,” but how does it compare to a similar-sized rental community in the area?
The true power of the Jacobs Brain SVI lies in our 20-year benchmarking database. We don’t just give you a number; we tell you how that number stacks up against UK industry averages.
- Is your cycle time longer than the sector norm?
- Is your conversion rate from visit to reservation lagging behind your peers?
Benchmarking can turn an internal metric into a competitive advantage. It allows you to see exactly where you are winning and where your “leaks” are costing you money.
Board-Ready Intelligence: Moving from Data to Narrative
One of the biggest challenges for Sales and Marketing Directors, is translating complex funnel data into something the Board or Investors can understand.
The SVI solves the “reporting headache.” Instead of presenting a 20-slide deck of fragmented charts and graphs, you can lead with a single score.
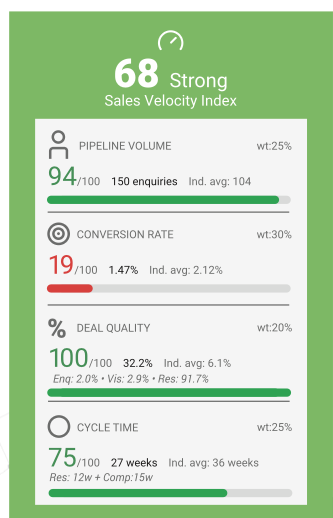
The SVI solves the “reporting headache.” Instead of presenting a 20-slide deck of fragmented charts, you can lead with a single score.
“Our community SVI is 78, which is 10 points above the regional benchmark. This has been driven by a 15% improvement in our visit-to-reservation conversion rate following our recent sales training.”
It provides a strategic narrative that is easy to digest, yet backed by hard, anonymised data. It moves the conversation away from “gut feelings” and toward actionable, data-driven growth
Take the Guesswork Out of Growth
Increasing occupancy shouldn’t feel like a roll of the dice. By tracking the Later Living Sales Velocity Index, you gain a “health check” for your entire operation; from the first digital click, call or CRM entry, to the day the resident moves in.
Stop wondering if your community is on track. Book a demo with Jacobs Brain today and get your Sales Velocity Index score.